In the new version of iWork ’08, Numbers was included along with the traditional Pages and Keynote applications. Numbers is basically Apple’s version of Microsoft Office Excel. In this article, I am just going cover to basics you need to give you a general idea of how much Numbers is capable of. To experience more of Numbers functionality, I highly recommend you use the Inspector panel (hold down the Option, ⌘ (Command), and “I” keys to activate it) along with the built-in Templates to truly take advantage of making graphs.
Calculating Graph Data
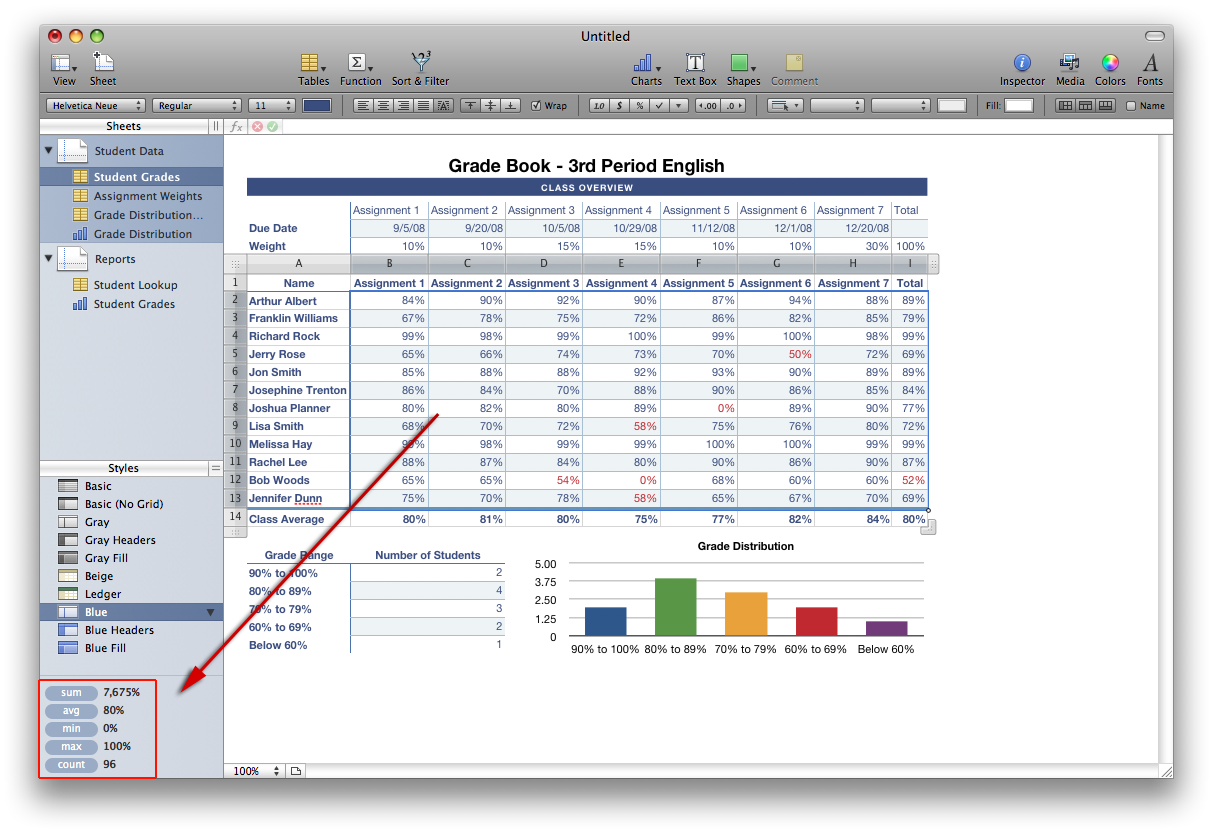
- When there is a graph with data filled in it, you can easily find out everything about the graph such as sums, averages, minimums, and maximums within a few clicks.
- To start, select the first item in the graph and hold down the Shift key.
- Then click anywhere else to finish making your selection.
- Instantaneously, you’ll notice results appear in the bottom left sidebar in Numbers.
screenshots: 2-4
Changing The Style For A Graph
- Select the graph for which you want to change the style.
- Now, take a look at the Styles menu in the left sidebar in Numbers.
- Choose any one of those styles and it will be automatically be applied to your graph.
screenshots: 1-3
Order Graph Data From Ascending/Descending
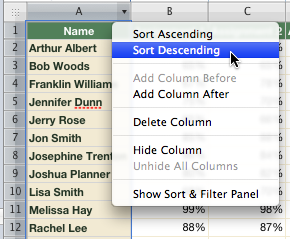
- As I mentioned previously, to select a specific range on a graph clicking once and hold the the Shift key, then click one more time to finalize your selection.
- Hover your mouse pointer over a graph until the column headers (“A”, “B”, “C”) appear.
- When you put hover your mouse pointer over one of the columns, you should see a small arrow appear.
- Click on the arrow, and choose “Sort Ascending” or “Sort Descending” to change the order of the data.
screenshots: 2-4
Changing The Data Units In A Graph
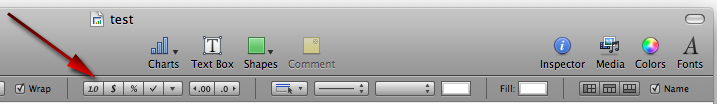
- Go ahead and select the parts of the graph you want to change the units for (remember: use the Shift key to select specific areas).
- Now go up to the Format Bar and select one the the units listed (1.0 $ % ✓).
screenshots: 2
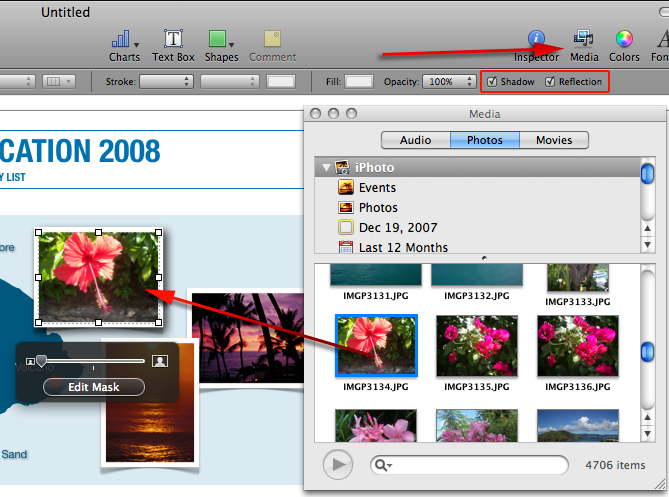
Adding Images To Your Graphs
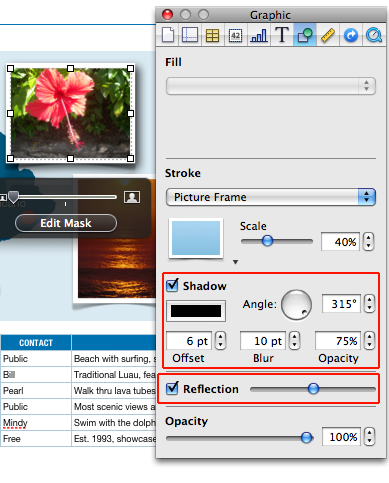
- Numbers makes adding images to your graphs incredibly easy.
- Select and spot to place your image and open up the Media Browser (located above the Format Bar beside Inspector).
- Now drag and drop your image into the graph wherever you’d like.
- You can also add a shadow or reflection via the Format Bar.
- Use the Inspector panel to change how your reflections and shadows appear.